

What you need to know
Over the last several months, the price Americans pay for gasoline and other fuels has increased significantly. In this brief, we describe these price changes as a first step in understanding their causes and consequences. We also pose questions that we will address in future briefs on this subject.
How much have prices increased?
Crude oil is a primary energy source for transportation and is also used for home heating and power production. In addition, about 20% of oil is used to produce plastics, and another 10% is used to produce asphalt and similar products.
The chart below uses data compiled by the Automobile Association of America (AAA) to show the price of crude oil (measured as West Texas Intermediate Crude, a type of oil extracted from wells in Texas), the average price of gasoline across the 50 states, and the average price of diesel, a type of fuel used in trucks, trains, and other cargo transports. (To make the comparison easier, the chart shows prices per gallon. Crude oil is usually priced in terms of 42-gallon barrels. As of September 15th, a barrel of West Texas Intermediate crude oil cost $103.81.)
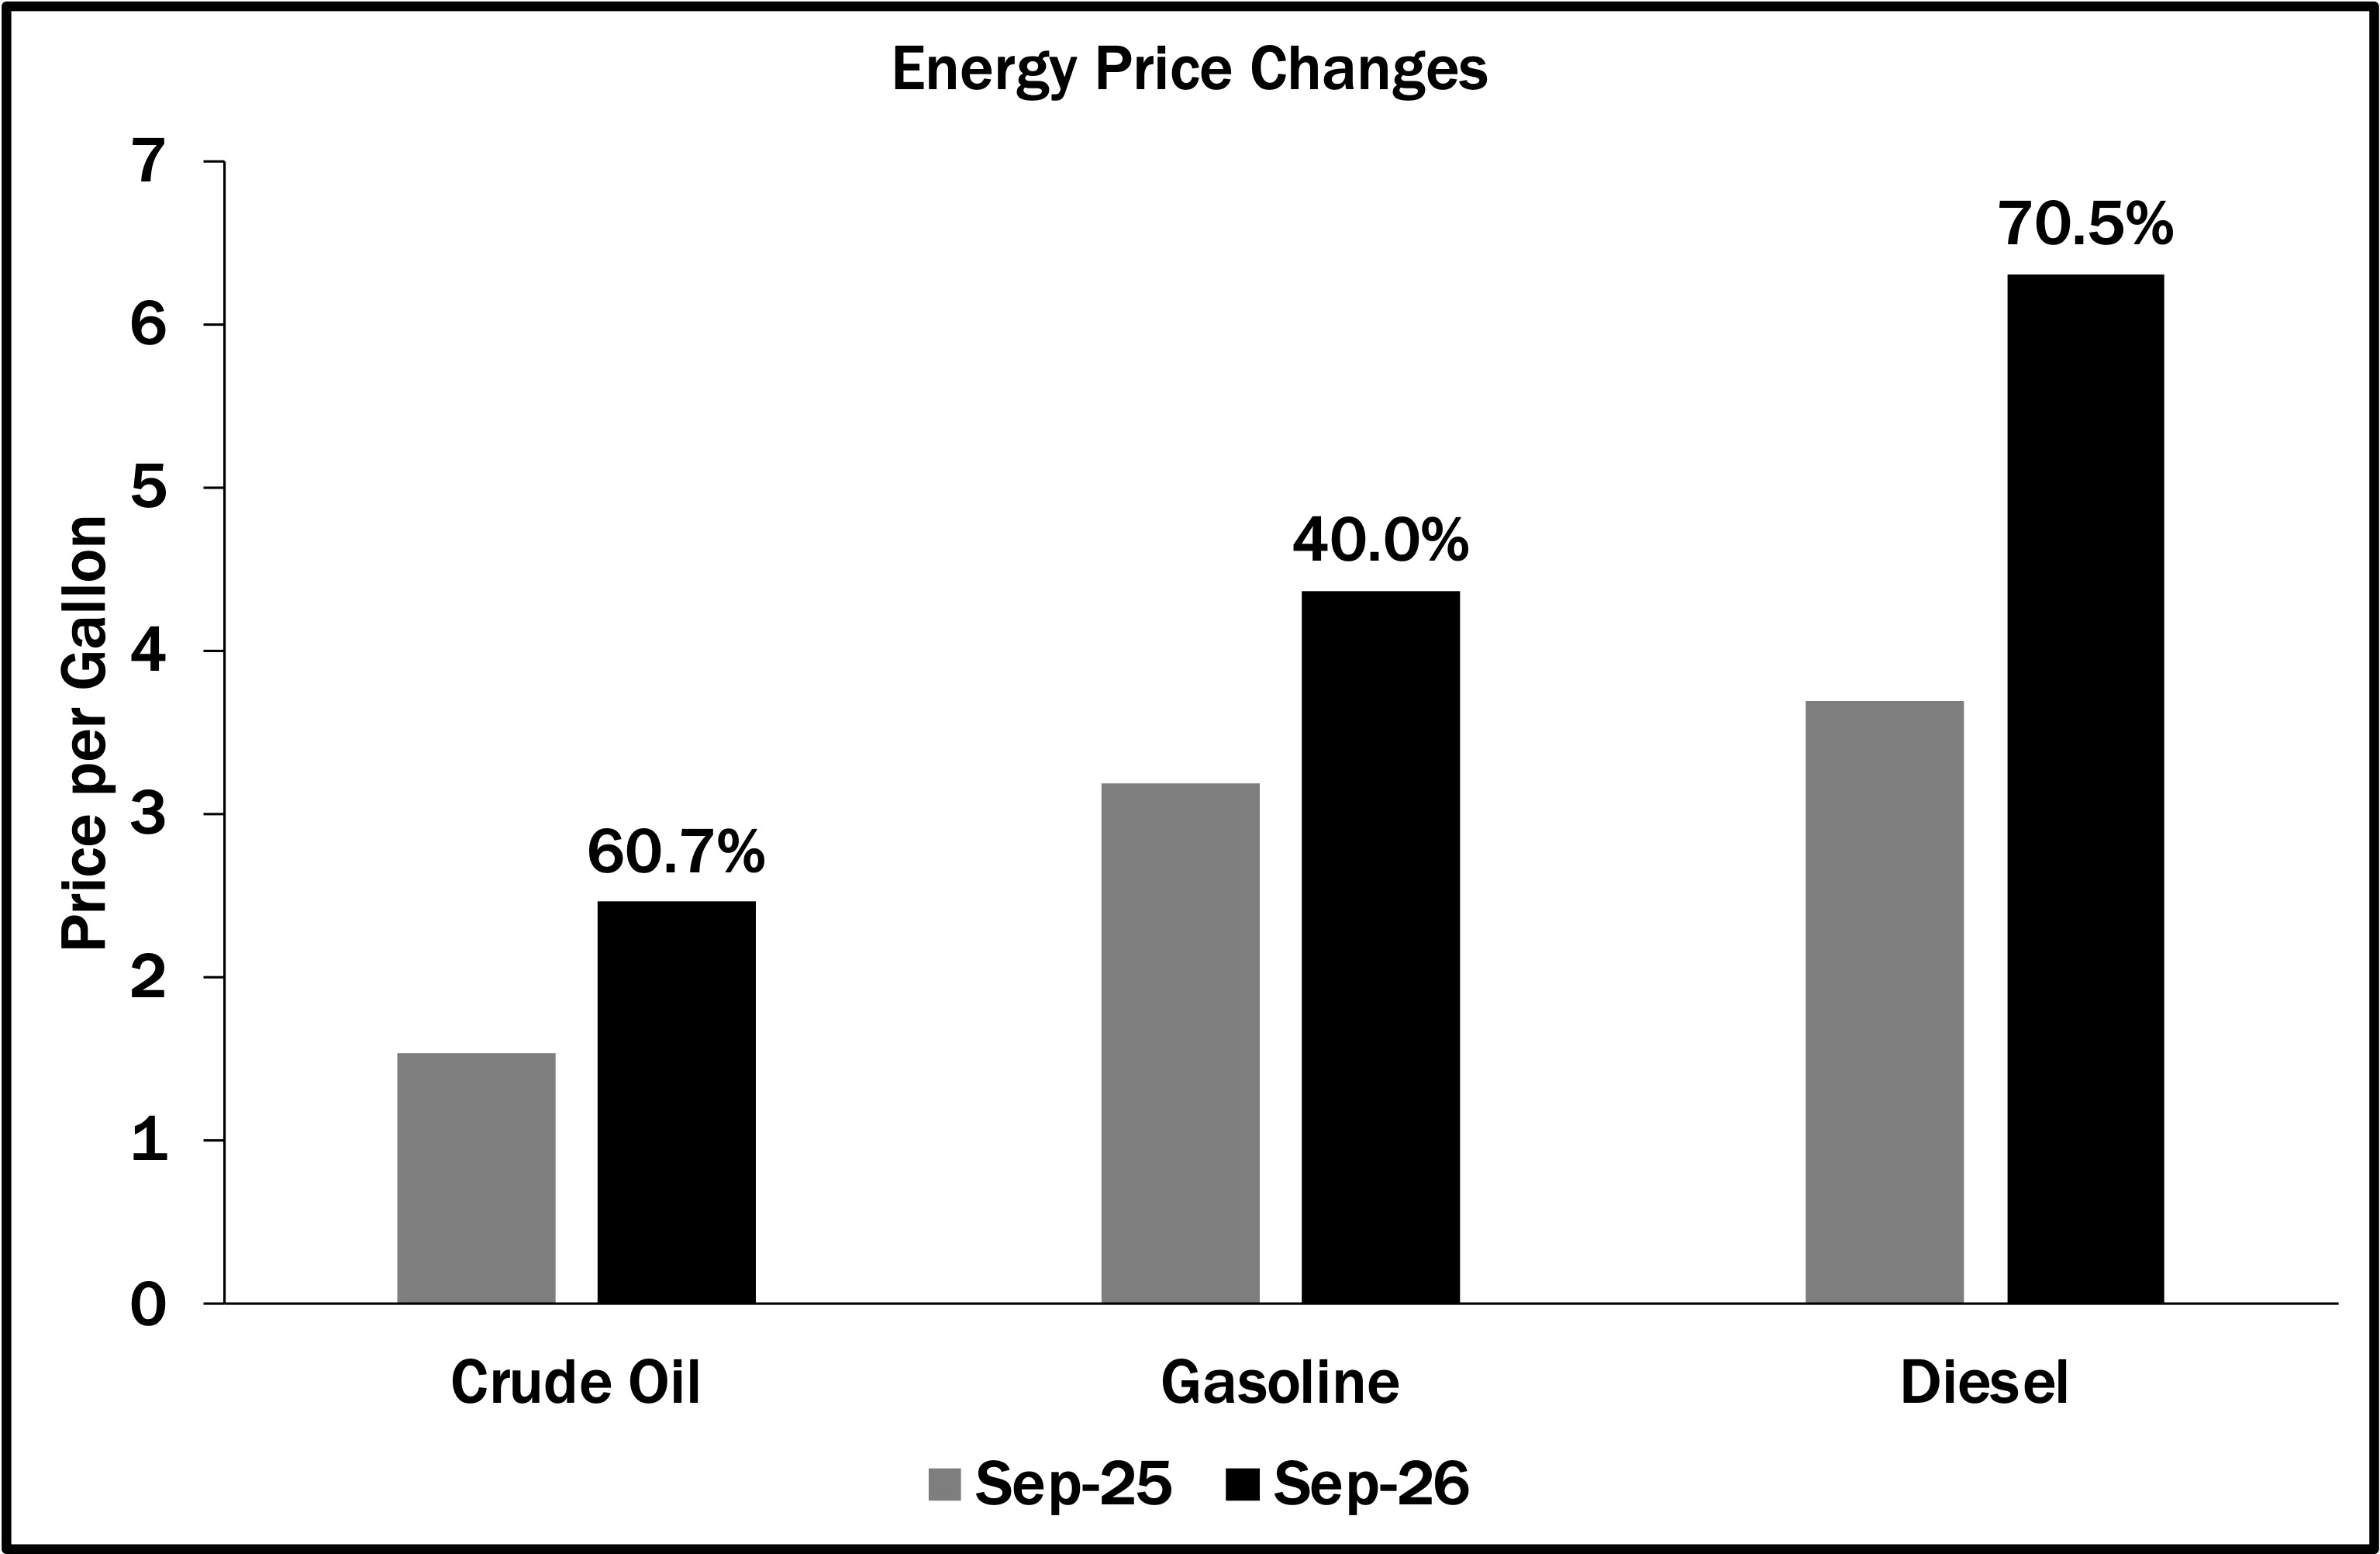
A comparison shows that prices for all three fuels have increased significantly over the last year. The chart also shows how fuel prices reflect the cost of the original commodity as well as the cost of refining and transportation. For example, a gallon of crude oil costs only about $2.50, while a gallon of gasoline costs over $4.00.
Why do energy prices differ across state lines?
The price consumers pay for a gallon of gasoline or diesel depends on several factors, including the cost of refining the fuel from crude oil, the cost of transporting the fuel from a refinery to the user, and various federal, state, and local taxes. The chart below shows the average price of gasoline across the 50 states as of September 15, 2026.
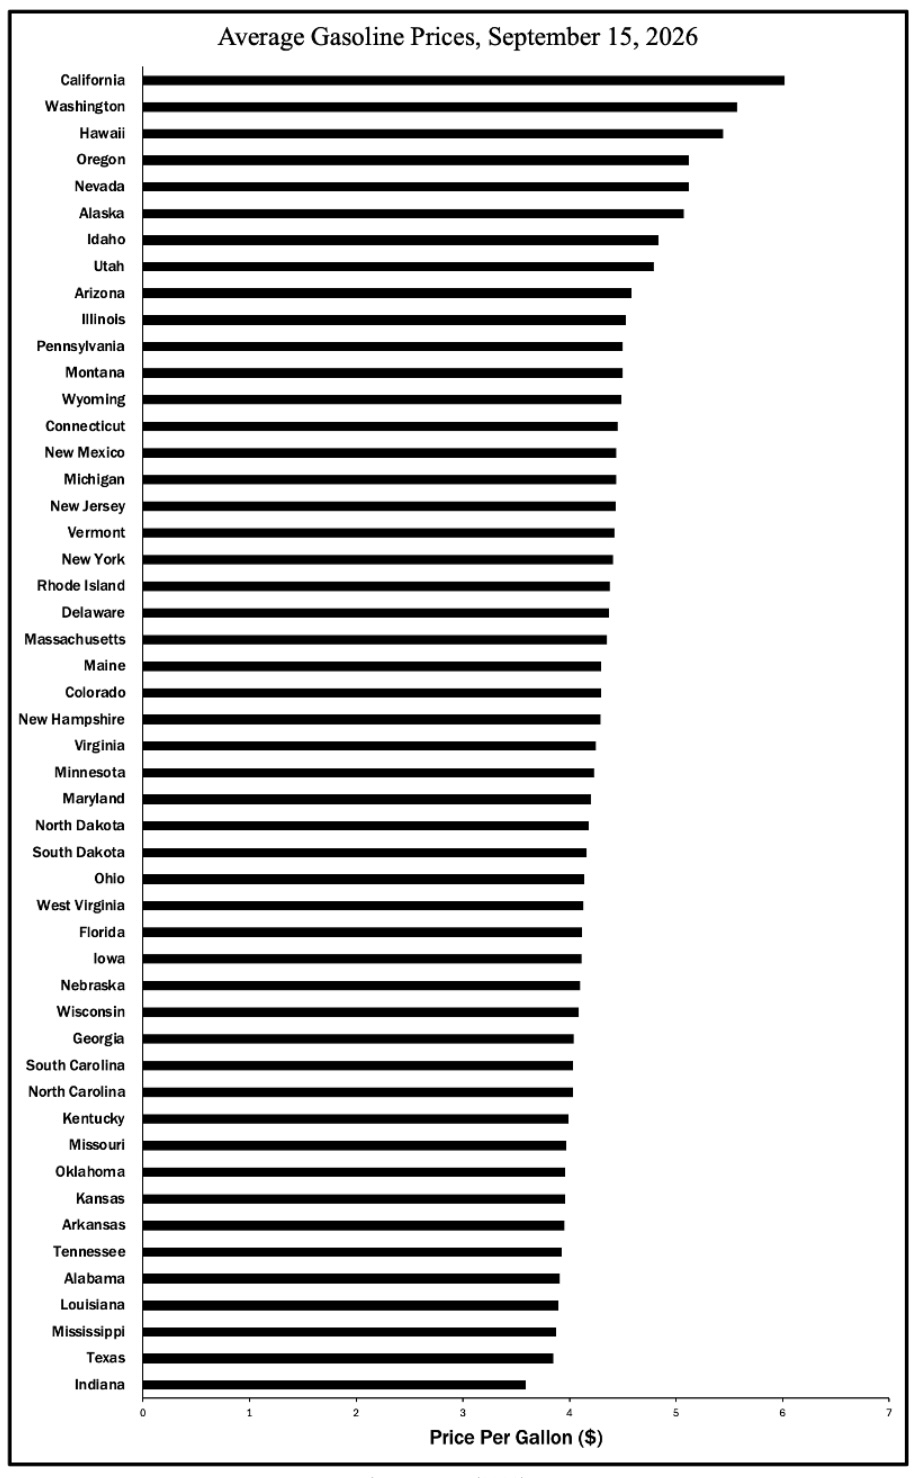
The chart shows radically different gasoline prices across the 50 states, with Indiana prices almost 50% lower than prices in California. Why the difference?
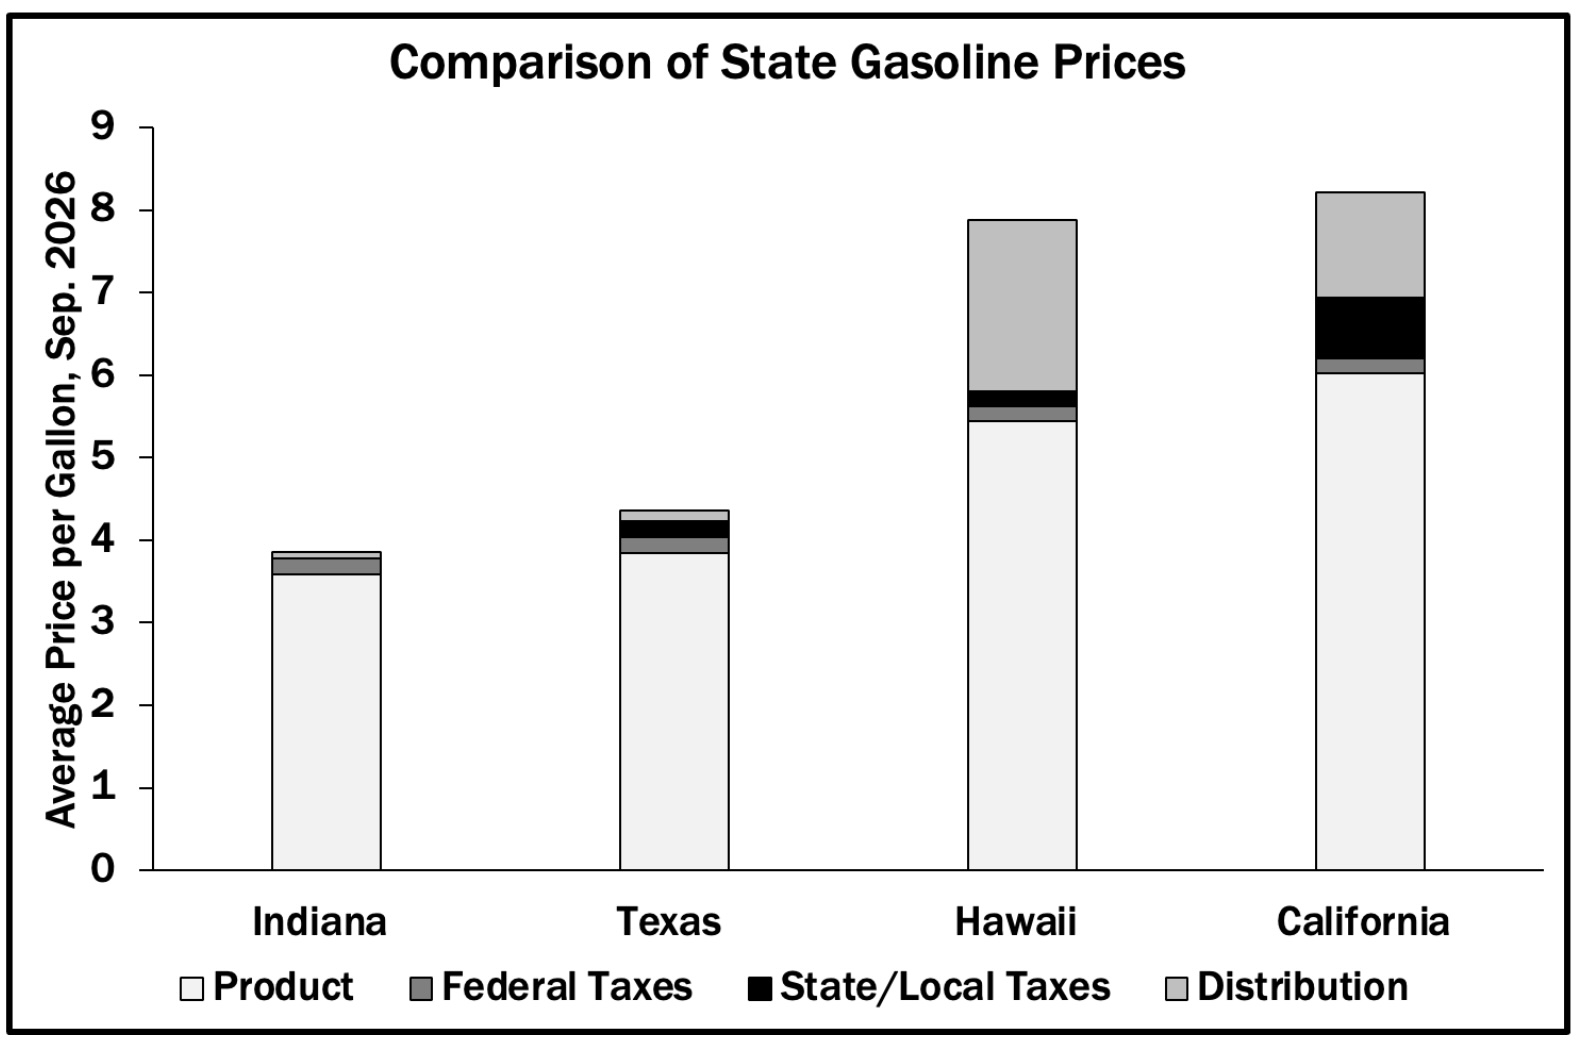
Two factors explain almost all of the discrepancy: taxes and transportation costs. Throughout the U.S., gasoline prices reflect an 18.4-cent federal tax that is used to pay for highway construction and maintenance. States and local governments also add their own taxes. In addition, most U.S. refineries that produce gasoline are located in three areas: states bordering the Gulf of America (more commonly known internationally as the Gulf of Mexico, officially renamed in the U.S. under a 2025 executive order signed by President Trump), Illinois, and New Jersey. Once gasoline is produced in one of these areas, it must be moved by pipeline, ships, or tanker trucks to other parts of the country. Transportation costs have a greater impact on increasing gas prices in West Coast states, as well as Alaska and Hawaii.
The third chart uses data from the U.S. Energy Information Administration to show how taxes and transportation costs contribute to gas price differences across states, focusing on two high-price states (California and Hawaii) and two low-price states (Indiana and Texas). Much of the price difference is explained by taxes and distribution costs. Hawaii and California have high state taxes, while Texas has low taxes and Indiana has currently suspended state gas taxes. California and Hawaii also have much higher distribution costs, as gasoline must be shipped by truck or barge to these states. However, even after accounting for these factors, gas prices are higher in Hawaii and California.
The Takeaway
This examination of energy prices raises questions that we will address in future policy briefs:
What factors explain the rise in oil prices, especially since the U.S. currently produces more oil than is consumed by all U.S. users?
If both gasoline and diesel come from the same raw product, why do their price increases differ so much?
Why do state-level prices differ, even after we account for local taxes and distribution costs?
What role should, or can, the government play in reducing energy prices?
Enjoying this content? Support our mission through financial support.
Further reading
Lindner. E. (2026) Why Gasoline Prices Vary So Much by State, County and City. The New York Times, https://tinyurl.com/4hww3h22, accessed 9/16/26
U.S. Energy Information Administration (2026) Analysis and Projections. https://www.eia.gov/analysis/, accessed 9/16/26.
Sources
MarketWatch (2026) WTI Crude Oil Spot Price. https://www.marketwatch.com/investing/future/cl.1, accessed 9/15/26.
AAA (2026) Gas Prices. https://gasprices.aaa.com/, accessed 9/15/26.
Energy Information Agency (2026) State taxes and fees on motor gasoline. https://www.eia.gov/todayinenergy/detail.php?id=67165, accessed 9/16/26.
Bureau of Transportation Statistics (2026) Cost of Transportation. https://data.bts.gov/stories/s/Transportation-Economic-Trends-Transportation-Cost/5bfv-z8ek/, accessed 9/16/26
Contributors
William Bianco (Research Director) is Professor of Political Science at Indiana University and Founding Director of the Indiana Political Analytics Workshop. He received his PhD from the University of Rochester. His teaching focuses on first-year students and the Introduction to American Government class. He is the co-author of American Politics Today, an introductory textbook published by W. W. Norton, now in its 9th edition, and authored a second textbook, American Politics: Strategy and Choice. His research program is on American politics, including Trust: Representatives and Constituents, and numerous articles. His op-eds have been published in the Washington Post, the Indianapolis Star, Newsday, and other venues.