
What is Right to Try?
Right to Try allows certain patients with life-threatening illnesses to request access to experimental drugs that have not yet been approved by the FDA. In 2018, the federal Right to Try Act was enacted after passing both houses of Congress with bipartisan support.
This policy was designed as a way to give terminally ill patients a chance to receive potentially life-saving treatments. In general, new drugs are approved by the FDA only after a multi-year, expensive three-step series of clinical trials: Phase I tests for safety, Phase II determines if the drug is effective, and Phase III compares the drug’s effectiveness against existing treatments. To be approved, a new treatment must produce positive results in all three trials and gain the support of a panel of outside experts.
While the FDA’s existing Early Access program allows patients to receive experimental treatments that have completed Phase II trials, the Right to Try gives patients access after the success of Phase I trials – that is, to treatments whose effectiveness is still in question. The other difference is that requests for Right to Try access are sent to drug manufacturers, whereas the FDA must formally approve Early Access requests; in practice, over 99% of requests are approved.
What are the arguments for and against Right to Try?
Supporters of Right to Try framed it as a question of autonomy and urgency. For patients facing terminal illness, time is of the essence. From this perspective, the policy is about allowing patients, in consultation with their doctors, to decide whether the potential benefits of an experimental treatment outweigh the risks. If approved options have failed, supporters argue, the government should not stand in the way of a patient’s final choices. Many lawmakers have described the policy as both compassionate and commonsense, emphasizing that it does not force anyone to participate but that people should be able to access experimental treatments as a matter of personal choice.
Critics of Right to Try generally agree on the desirability of expanding access but question whether this law achieves this outcome safely or effectively. Drugs that have only passed Phase I trials have been tested for basic safety, but only for small numbers of patients. Under Right to Try, patients may be exposed to treatments that ultimately do not work, diverting attention away from alternative pathways with potential greater efficacy, and may in the end actually cause more harm.
How does Right to Try Work?
To use Right to Try, patients must have exhausted approved treatment options and be unable to participate in a clinical trial. A physician must agree to oversee the treatment, and the manufacturer must be willing to provide the drug. The law established national rules for how experimental drugs can be provided in these cases, standardizing what had previously been a patchwork of state laws.
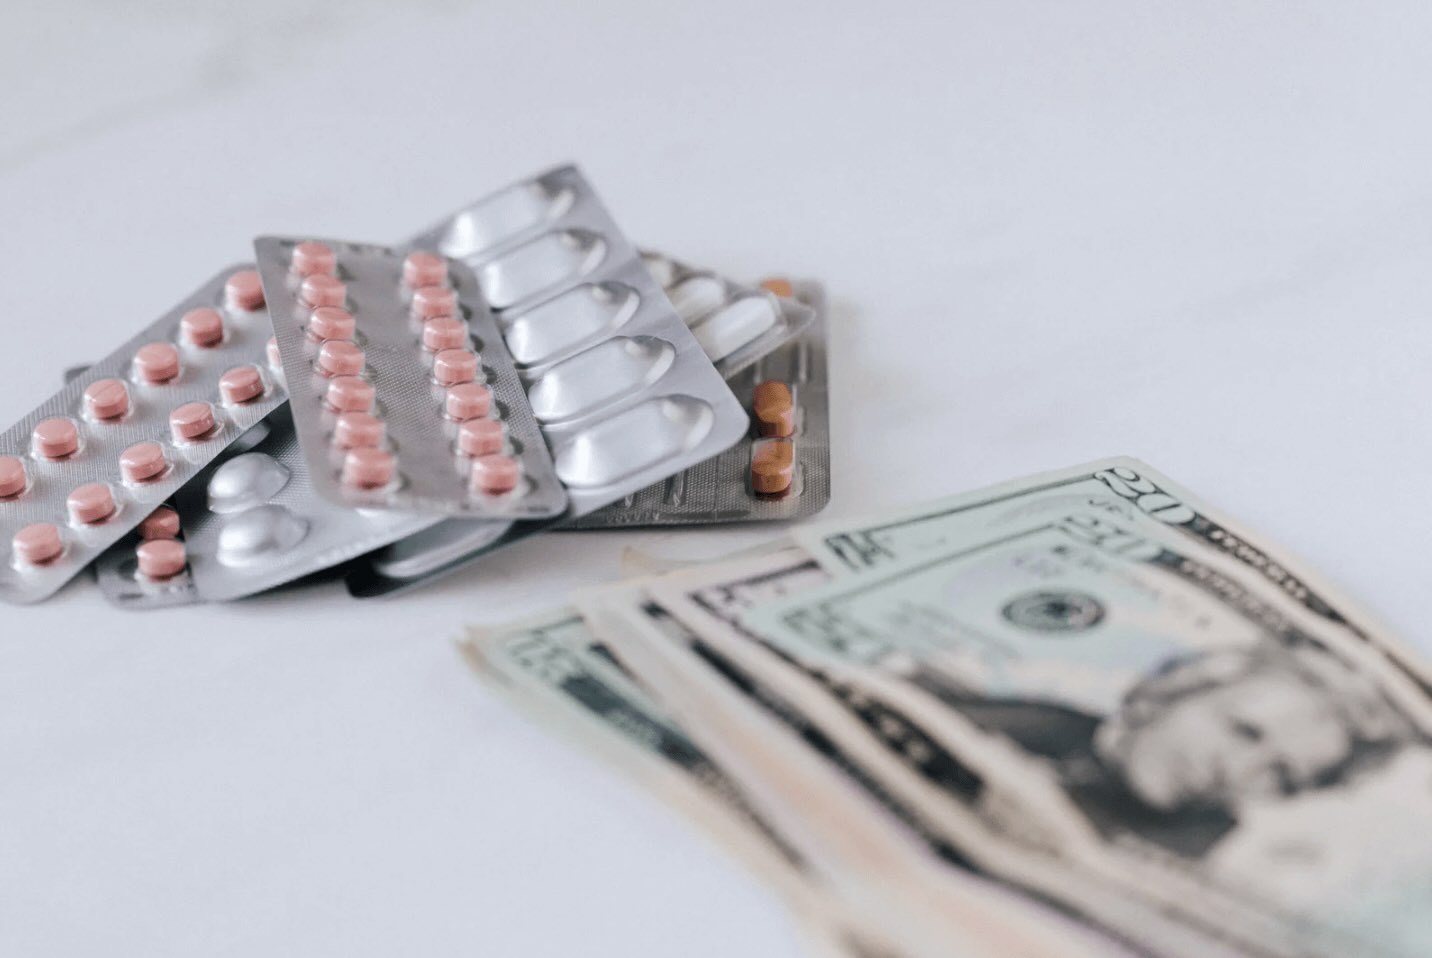
The law does not require drug companies to provide access to experimental treatments, and insurance companies are not required to cover the cost. In practice, patients generally must pay for the treatment themselves (often large sums), and availability depends on whether a manufacturer chooses to participate. The law also limits liability for drug manufacturers and providers.
How many patients use the Right to Try?
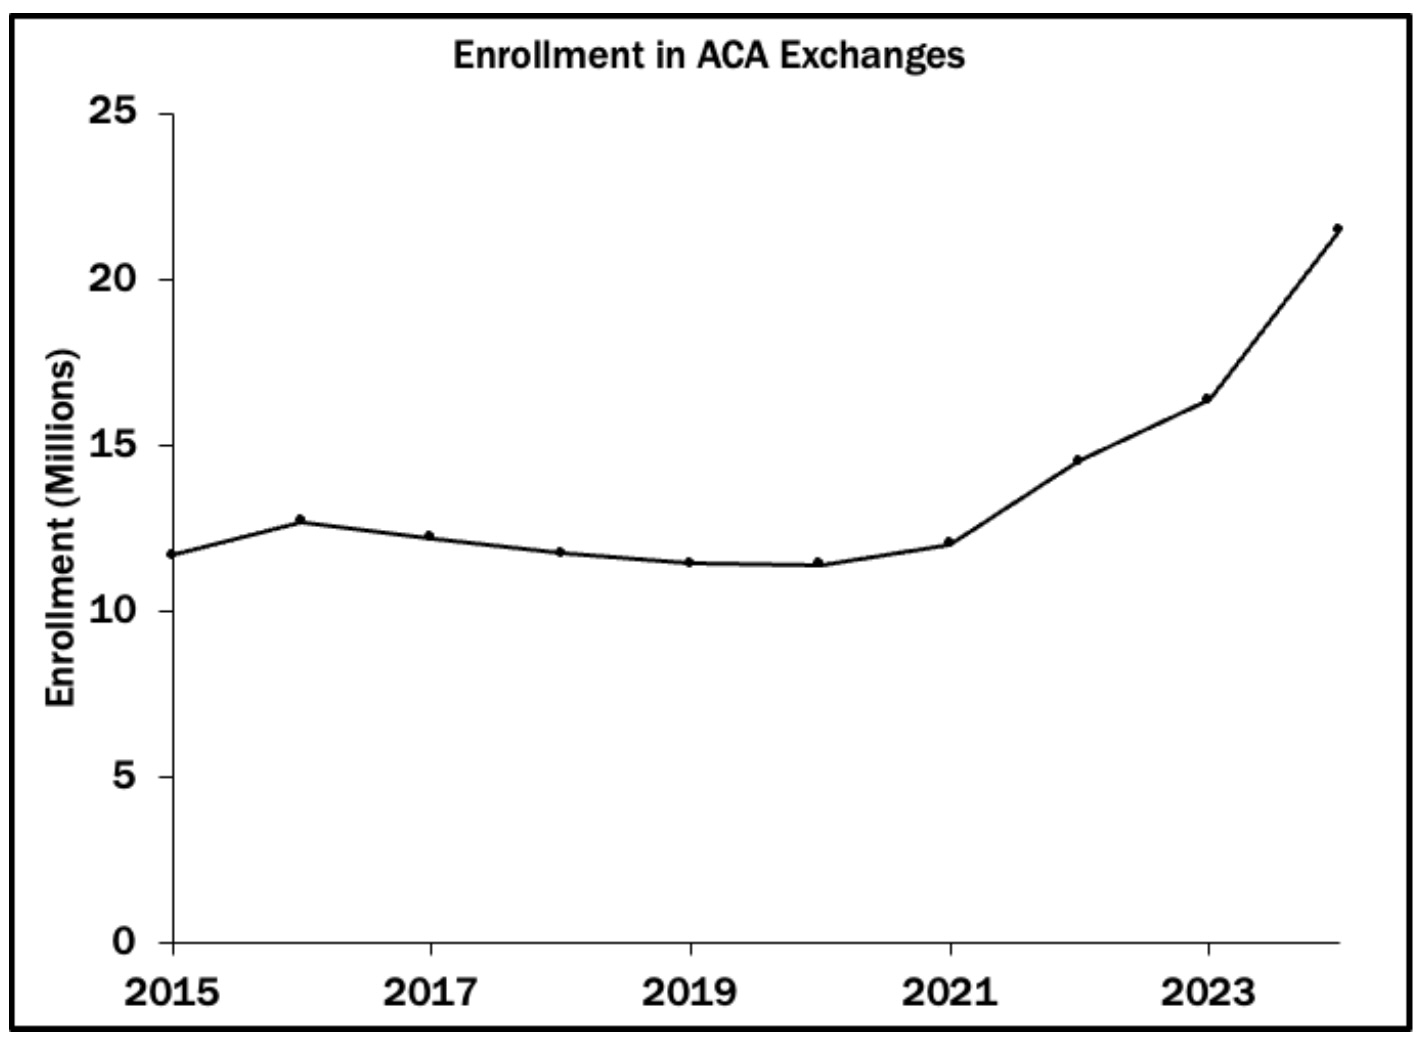
Not many. The FDA relies on manufacturers’ reports to determine how many drugs have been distributed under the Right to Try. The chart below shows data since the law was enacted in 2018.
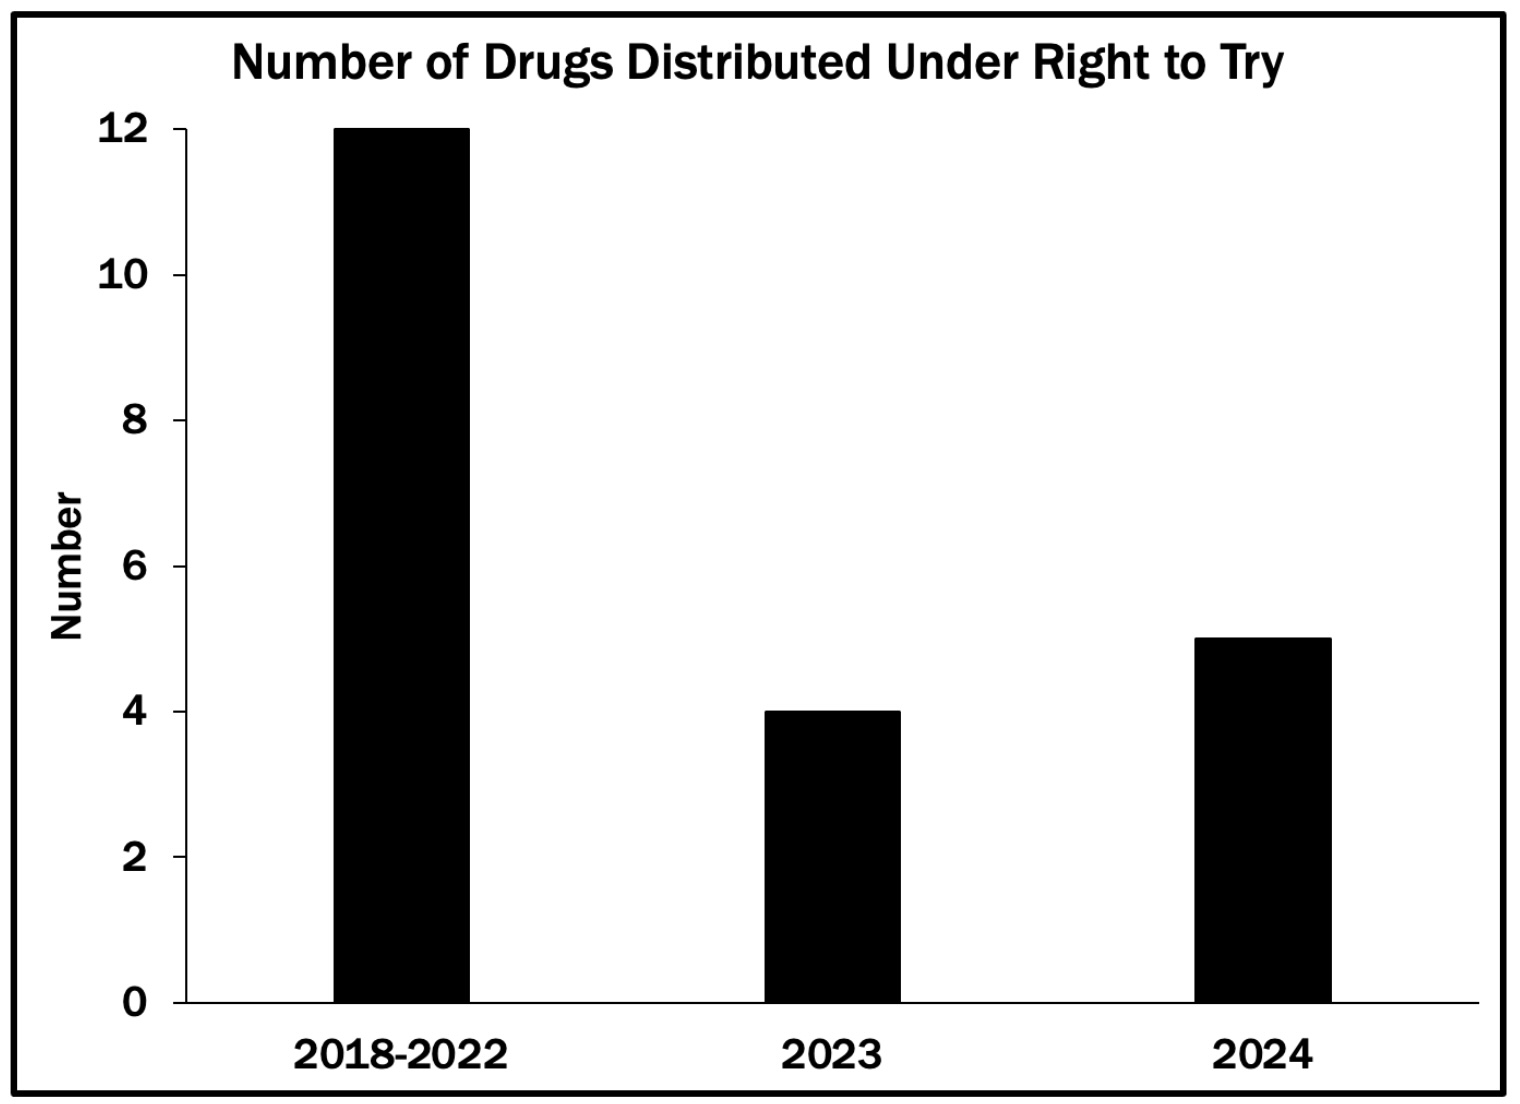
Manufacturers are not required to report the number of patients they have treated under Right to Try. The best estimates are that per-drug usage is low, between 1 and 10 patients. Thus, the number of Americans who utilize the Right to Try is approximately 50 per year.
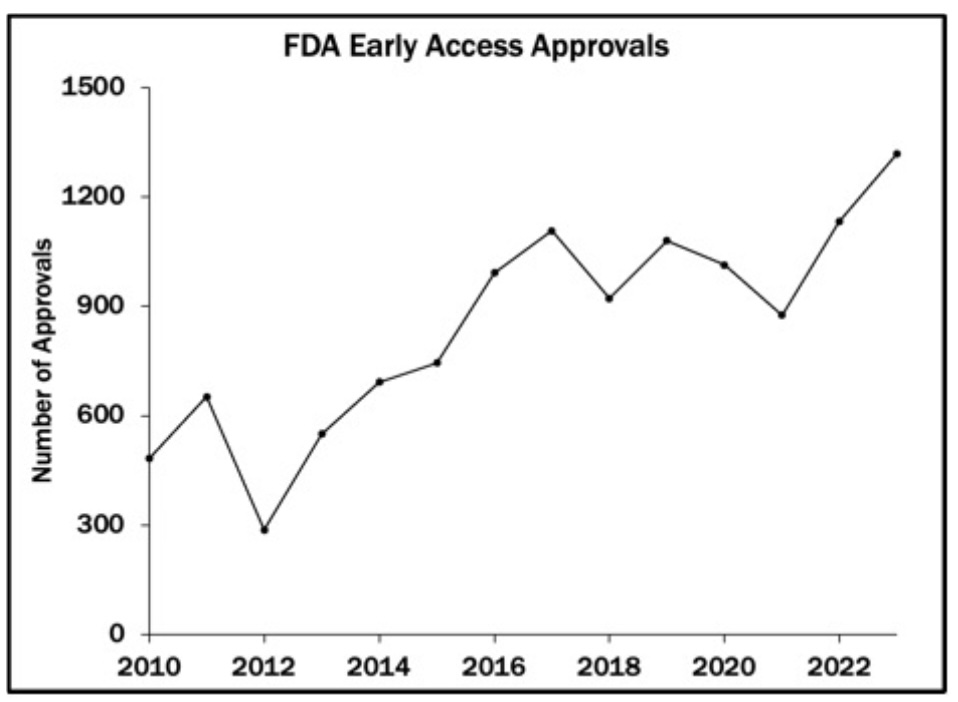
In contrast, the chart below shows the number of Americans who access Phase II treatments through the FDA's Early Access program – nearly 1,500 in 2023, the most recent data year.
Why are so few patients using the Right to Try?
Some patients are likely deterred by the cost of accessing Right to Try drugs. Others may opt for the Early Access Program to obtain drugs that are at a later stage of the approval process and have a better chance of working. And it may be that for many patients who are eligible for Right to Try, there is no experimental drug available that addresses their condition.
The underlying issue with the Right to Try program is that most Phase I drugs are unlikely to work. Only about 10% of drugs that enter clinical trials are later approved. Even for drugs with positive Phase I results, the chances for approval (meaning they are found to work better than existing treatments) are only slightly higher. Given these odds, a terminally ill patient might opt for the Right to Try because they have no other options. Still, another patient in the same situation might forgo additional treatment given the potential for side effects and the low chances of success.
How has Right to Try expanded beyond its original scope?
Lawmakers have proposed extending Right to Try to other areas such as access to certain controlled substances, including medical marijuana and psychedelic therapies, even in states where it’s not permitted, as well as experimental treatments during public health emergencies.
These proposals reflect a broader debate about the government's role in regulating access to medical treatments. Up to now, the FDA has been a gatekeeper in deciding which treatments are made available to patients in America. Right to Try and its proposed extensions would reduce the importance of the FDA approval process by creating an alternate pathway for public release of new drugs. The result would be an expanded set of potential treatments, but less government review of the safety and effectiveness of these pharmaceuticals.
The Takeaway
Right to Try created a new pathway for accessing experimental drugs, one that bypasses the FDA approval process and enables patients to receive treatments whose effectiveness has not been demonstrated in a clinical trial.
In practice, access still largely depends on drug manufacturers' willingness to provide experimental drugs and patients' ability to pay for them. Available evidence suggests that very few patients have utilized Right to Try.
The law’s most significant impact may be as a demonstration that treatments can be released to the public without FDA approval.


.png)


.png)